
 📖Chuyên sâu
How to Set Up webpack From Scratch
A bundler you can reason about: entry, output, loaders, plugins and the optimisations mode turns on behind your back — built up from an empty directory, with every byte count, build time and error message measured. Including the four things every webpack tutorial (and my own plan) got wrong.
CuongThai
30 tháng 7, 2026 · 27 phút đọc · 356 lượt xem
Most people meet webpack through a config file someone else wrote. It works, nobody understands it, and the first time a build breaks the fix is to copy a different config from Stack Overflow and hope. That's not webpack being hard. That's what happens when you inherit the answer without the question.
So this guide builds one up from an empty directory, and every number in it came out of a real terminal. The version matters more than usual here, because webpack changed something important recently and most tutorials — including the notes I wrote for myself before starting — are now wrong about it:
webpack 5.109.2 · webpack-cli 6.0.1 · Node 22.21.0 · macOS
I also ran one demo against webpack 5.90.0, because that's the version Next.js 14.2.15 ships inside itself, which is what this site is built with. The two versions disagree, and knowing which side of that line you're on saves you an afternoon.
The smallest thing that counts as a build
Two files. No config, no webpack.config.js, nothing.
// src/math.js
export function add(a, b) {
  return a + b;
}

export function subtract(a, b) {
  return a - b;
}

// Nobody imports this. Does it survive the bundle?
export function neverImportedHelper(list) {
  return list.reduce((acc, n) => acc + n * 1337, 0);
}
// src/index.js
import { add } from './math.js';

const el = document.createElement('p');
el.textContent = `2 + 3 = ${add(2, 3)}`;
document.body.append(el);
One command:
npx webpack --entry ./src/index.js
asset main.js 110 bytes [emitted] [minimized] (name: main)
orphan modules 250 bytes [orphan] 1 module
./src/index.js + 1 modules 391 bytes [built] [code generated]

WARNING in configuration
The 'mode' option has not been set, webpack will fallback to
'production' for this value.

webpack 5.109.2 compiled with 1 warning in 123 ms
Read that output slowly, because it already contains four facts about webpack.
asset main.js — the default output is dist/main.js. You didn't ask for dist, or for the name main. Those are defaults, and being able to name a default is the difference between configuring webpack and negotiating with it.
[minimized] — and the warning explains why. With no mode, webpack picks production, which turns on the minifier. So the very first thing you should do in any config is state your mode explicitly. Silence here means "I'll guess", and it guesses production.
orphan modules 250 bytes [orphan] 1 module — that's math.js. "Orphan" means the module did not survive as a module: it got merged into another one. The next line, ./src/index.js + 1 modules, is webpack telling you it fused two source files into a single unit. That's module concatenation, sometimes called scope hoisting, and it's on by default in production.
391 bytes in, 110 bytes out. Let's look at what those 110 bytes are, because this is where I got my first surprise.
cat dist/main.js
(()=>{"use strict";const t=document.createElement("p");
t.textContent="2 + 3 = "+5,document.body.append(t)})();
I was expecting a minified add function and a call to it. Instead the arithmetic is gone: "2 + 3 = "+5. Concatenation put add in the same scope as its only caller, then the minifier inlined the one-line function and folded the constant. Let me check that against the bundle rather than trusting my reading of it:
for f in neverImportedHelper 1337 subtract add; do
  printf "%-22s %s\n" "$f" "$(grep -c "$f" dist/main.js)"
done
neverImportedHelper    0
1337                   0
subtract               0
add                    0
Four for four. The unused export is gone — that part I predicted. But add, which is imported and is called, is also gone as an identifier, because after inlining there was nothing left to name. The bundle contains the answer, not the function.
That's a nice trick and a bad measuring instrument, and I'll come back to why in the tree shaking section.
What webpack actually emits
110 bytes of clever is a terrible way to learn the shape of a bundle. So here's the same two files in development mode, which turns all the cleverness off. First, a real config:
// webpack.config.js
const path = require('node:path');

module.exports = {
  mode: 'development',
  entry: './src/index.js',
  output: {
    path: path.resolve(__dirname, 'dist'),
    filename: 'bundle.js',
    clean: true,
  },
};
asset bundle.js 5.33 KiB [emitted] (name: main)
runtime modules 1.07 KiB 3 modules
cacheable modules 391 bytes
  ./src/index.js 141 bytes [built] [code generated]
  ./src/math.js 250 bytes [built] [code generated]
webpack 5.109.2 compiled successfully in 58 ms
391 bytes of source became 5.33 KiB, and math.js is a real module again rather than an orphan. The extra weight is runtime modules 1.07 KiB 3 modules plus the wrapper around each module. Here's the wrapper, trimmed:
/******/ (() => { // webpackBootstrap
/******/   "use strict";
/******/   var __webpack_modules__ = ({

/***/ "./src/index.js"
(__unused_webpack_module, __webpack_exports__, __webpack_require__) {
eval("{__webpack_require__.r(__webpack_exports__);\n ... }");

/***/ },

/***/ "./src/math.js"
(__unused_webpack_module, __webpack_exports__, __webpack_require__) {
eval("{ ... }");

/***/ }
/******/ });
And at the bottom, the thing that starts it all:
/******/ let __webpack_exports__ = __webpack_require__("./src/index.js");
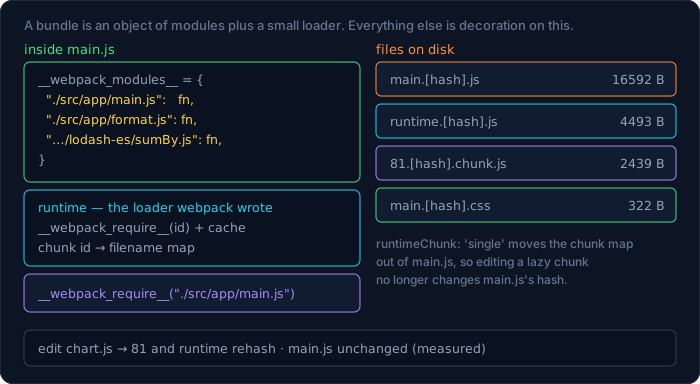
That's the whole idea of a bundler in one screen. Your modules become values in an object keyed by path, and __webpack_require__ is a tiny module loader that runs them on demand and caches the result. Everything else webpack does — loaders, splitting, hashing, HMR — is decoration on that structure.
Two details worth naming while they're on screen. The exports aren't copied, they're defined as getters:
__webpack_require__.d(__webpack_exports__, {
  add: () => (/* binding */ add),
  neverImportedHelper: () => (/* binding */ neverImportedHelper),
  subtract: () => (/* binding */ subtract)
});
That's how webpack gives you ES module live bindings on top of an object graph — read the export later and you see the current value, not a snapshot.
And each module body is inside eval("..."). That's not webpack being paranoid, it's the default devtool in development. The file even says so at the top:
ATTENTION: The "eval" devtool has been used (maybe by default in
mode: "development"). This devtool is neither made for production
nor for readable output files.
Source maps get their own section later, with the byte counts.
The five options you actually configure
A webpack config has a lot of surface area and a small centre. The centre is this:
const path = require('node:path');

module.exports = {
  mode: 'production',
  entry: './src/app/main.js',
  output: {
    path: path.resolve(__dirname, 'dist'),
    filename: '[name].js',
    clean: true,
  },
  module: { rules: [] },
  plugins: [],
};
mode—development,productionornone. Not a flag: it changes about a dozen other defaults, and I'll measure exactly which ones.entry— where the graph starts. A string, or an object for multiple entries ({ app: './src/app.js', admin: './src/admin.js' }), which is how[name]infilenamegets its value.output.path— must be absolute. Relative paths are a hard config error, not a warning:
configuration.output.path: The provided value "./out" is not an
absolute path!
  -> The output directory as **absolute path** (required).
output.clean: true— wipes the directory before writing. Without it, yesterday's hashed files pile up forever, and you will eventually deploy a folder where half the files are from a build nobody remembers.module.rules— loaders: how to turn a file that isn't JavaScript into something webpack can put in the graph.plugins— hooks into the build lifecycle, which is everything loaders can't express.
The rest of this guide is those last two, plus the optimisations mode turns on behind your back.
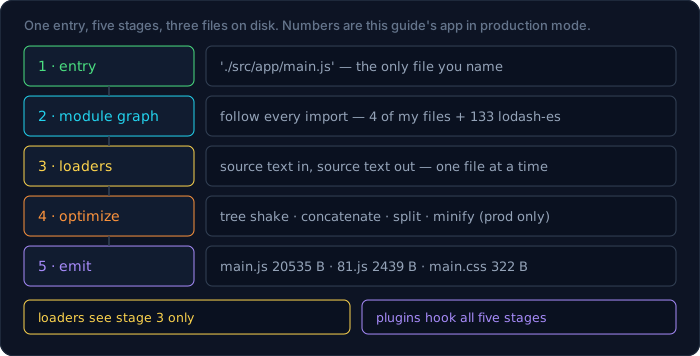
For that I need an app worth measuring, so from here on the entry is four files that do something mildly realistic: a formatted price list, an external dependency, a stylesheet, and a chart module that is only loaded when you click.
// src/app/format.js
export const currency = (n) =>
  new Intl.NumberFormat('vi-VN', {
    style: 'currency',
    currency: 'VND',
  }).format(n);

export const percent = (n) => `${(n * 100).toFixed(1)}%`;

// Used nowhere. It is here to be looked for later.
export const slugify = (s) =>
  s.toLowerCase().trim().replace(/[^a-z0-9]+/g, '-');
// src/app/main.js
import './styles.css';
import { currency, percent } from './format.js';
import sumBy from 'lodash-es/sumBy.js';

const rows = [
  { label: 'Pro membership', amount: 299000, share: 0.62 },
  { label: 'Course bundle', amount: 149000, share: 0.31 },
  { label: 'Sticker pack', amount: 35000, share: 0.07 },
];

const card = document.createElement('div');
card.className = 'card';
card.innerHTML = rows
  .map((r) => `<div>${r.label} — ${currency(r.amount)}</div>`)
  .join('');

const total = document.createElement('div');
total.className = 'card__total';
total.textContent = `Total ${currency(sumBy(rows, 'amount'))}`;
card.append(total);
document.body.append(card);

document.querySelector('.card__total')
  .addEventListener('click', async () => {
    const { drawChart } = await import('./chart.js');
    drawChart(rows);
  });
// src/app/chart.js
import groupBy from 'lodash-es/groupBy.js';
import orderBy from 'lodash-es/orderBy.js';

export function drawChart(rows) {
  const buckets = groupBy(rows, (r) =>
    r.share > 0.5 ? 'major' : 'minor');
  const sorted = orderBy(rows, ['amount'], ['desc']);
  const svg = sorted
    .map((r, i) => `<rect y="${i * 24}" width="${r.share * 400}" />`)
    .join('');
  const box = document.createElement('div');
  box.innerHTML = `<svg viewBox="0 0 400 80">${svg}</svg>`;
  box.dataset.buckets = Object.keys(buckets).join(',');
  document.body.append(box);
  return box;
}
Loaders, and the one you probably don't need any more
The standard story goes: webpack only understands JavaScript, so to import './styles.css' you install css-loader and style-loader and add a rule. I was ten minutes from writing exactly that. Then I ran the build with no rules at all:
module.exports = {
  mode: 'development',
  entry: './src/app/main.js',
  output: { path: path.resolve(__dirname, 'dist'), clean: true },
};
asset main.js 210 KiB [emitted] (name: main)
asset main.css 471 bytes [emitted] (name: main) 1 related asset
asset vendors-node_modules_lodash-es_groupBy_js-...js 31.8 KiB
asset src_app_chart_js.js 2.06 KiB [emitted]
css ./src/app/styles.css 321 bytes [built] [code generated]
webpack 5.109.2 compiled successfully in 172 ms
No error. It emitted main.css. That last stats line — css ./src/app/styles.css — is webpack reporting a module of type css, a first-class type alongside JavaScript. And the file on disk is real CSS, with a source map:
cat dist/main.css
:root {
  --bg: #0d1424;
  --fg: #e2e8f0;
  --accent: #4ade80;
}

body {
  margin: 0;
  background: var(--bg);
  color: var(--fg);
}
/*# sourceMappingURL=main.css.map*/
Why: webpack now enables CSS handling by itself. Ask webpack, don't ask a blog post:
const webpack = require('webpack');
const c = webpack({ mode: 'development', entry: './src/app/main.js' });
console.log('experiments.css  =', c.options.experiments.css);
console.log('experiments.html =', c.options.experiments.html);
experiments.css  = auto
experiments.html = auto
'auto' means "on when the target can use it". So on webpack 5.109, css-loader and style-loader are optional for plain CSS.
Now the part that decides whether that helps you. Same two files, same import, on the webpack version that Next.js 14.2.15 bundles internally:
npm i webpack@5.90.0
webpack = 5.90.0
experiments.css mặc định = undefined
webpack 5.90.0 · number of compile errors: 1
  Module parse failed: Unexpected token (1:5)
  You may need an appropriate loader to handle this file type,
  currently no loaders are configured to process this file.
  > body { margin: 0; }
Same code, same import, one hard error — because in 5.90 the option isn't 'auto', it's undefined. So "do I need css-loader" has no general answer; it has a version. Check yours before you follow anyone's config, including this one:
npx webpack --version
And for a file type webpack genuinely has no built-in handling for, the error is the one you'll see for the rest of your career. Here's .scss on 5.109:
ERROR in ./src/app/theme.scss 1:5
Module parse failed: Unexpected character '4' (1:5)
File was parsed as module type 'javascript/auto'.
You may need an appropriate loader to handle this file type,
currently no loaders are configured to process this file.
> 1 | $c: #4ade80;
    |      ^
  2 | .card { color: $c; }
 @ ./src/app/main.js 1:0-22
Learn to read the last line. @ ./src/app/main.js 1:0-22 is the importer — the file and character range that pulled the broken thing in. When a build fails on a file you've never heard of inside node_modules, that line is how you find out which of your imports is responsible.
Three ways to ship the same stylesheet
Since CSS is the loader example everyone learns, it's worth measuring all three approaches instead of asserting one. Same entry, same production mode, content hashes on:
// A — native, no rules at all
{ mode: 'production', entry: './src/app/main.js' }

// B — style-loader: CSS ends up inside the JS
{ module: { rules: [
  { test: /\.css$/, use: ['style-loader', 'css-loader'] },
] } }

// C — mini-css-extract-plugin: separate file, the pre-5.9x standard
{ module: { rules: [
    { test: /\.css$/, use: [MiniCss.loader, 'css-loader'] },
  ]),
  plugins: [new MiniCss({ filename: '[name].[contenthash:8].css' })] }
### native
   16592 B  main.ef0c3cbf.js
    4493 B  runtime.7af428fe.js
    2439 B  81.cd90ecd1.chunk.js
     322 B  main.763b3ac8.css

### style-loader
   20705 B  main.2b992c4d.js
    3340 B  runtime.6ce7213b.js
    2439 B  81.cd90ecd1.chunk.js

### mini-css-extract
   16592 B  main.8e24b89d.js
    3186 B  runtime.fbac8b8a.js
    2439 B  81.cd90ecd1.chunk.js
     322 B  main.763b3ac8.css
Three things fall out of that table.
style-loader has no .css file at all — the stylesheet is a string inside main.js that gets injected into a <style> tag at runtime. That's why its main.js is 4,113 bytes bigger. It also means your styles can't load in parallel with your JavaScript, and can't be applied until the JavaScript has run.
Native CSS and mini-css-extract produce a byte-identical main.css (322 B, same hash 763b3ac8) and identically sized JS. The one place they differ is the runtime: native is 4,493 B against 3,186 B, so webpack's built-in CSS loading runtime currently costs about 1.3 KB more than the plugin's. I did not expect the built-in to be the heavier one.
Now the part that actually matters in production. Change one colour in styles.css — nothing else — and rebuild all three:
### native (before)          ### native (after)
   main.763b3ac8.css           main.6950e47e.css   ← changed
   main.ef0c3cbf.js            main.ef0c3cbf.js
   runtime.7af428fe.js         runtime.7af428fe.js

### style-loader (before)    ### style-loader (after)
   main.2b992c4d.js            main.922df189.js    ← changed
   runtime.6ce7213b.js         runtime.6ce7213b.js

### mini-css-extract (b)     ### mini-css-extract (after)
   main.763b3ac8.css           main.6950e47e.css   ← changed
   main.8e24b89d.js            main.8e24b89d.js
With a separate CSS file, a CSS edit invalidates 322 bytes of cache. With style-loader, the same edit invalidates the whole 20 KB JavaScript bundle, because the CSS is inside it. That's the argument, and it's the same argument for both native CSS and mini-css-extract: keep CSS out of the JS in production, and use style-loader only in development where the injection is convenient and nothing is cached.
babel-loader, and the thing it does not do
A loader is a function from source text to source text. babel-loader is the archetype: it hands your JavaScript to Babel and passes the result on.
{
  test: /\.js$/,
  exclude: /node_modules/,
  use: {
    loader: 'babel-loader',
    options: {
      presets: [['@babel/preset-env', { targets: 'defaults' }]],
    },
  },
}
Two ordering rules that cause most loader confusion. Loaders in a use array run right to left (['style-loader', 'css-loader'] means css-loader first). And exclude: /node_modules/ is on almost every Babel rule you'll ever see, because transpiling your dependencies is usually a waste of time.
I assumed Babel would show up clearly in both build time and bundle size. Four builds of the same app, median of five runs each:
| Setup | Total code | Median build |
|---|---|---|
| no babel-loader | 23,296 B | 343 ms |
targets: 'defaults' |
23,300 B | 549 ms |
targets: 'last 2 Chrome versions' |
23,300 B | 346 ms |
targets: 'ie 11' |
26,080 B | 372 ms |
targets: 'defaults' cost four bytes. In 2026, the browsers in the defaults browserslist query support the syntax I wrote, so Babel is transforming almost nothing. The build-time difference is inside the run-to-run noise on this machine — my five runs of the no-Babel build ranged 338–489 ms. Babel only starts costing you when you actually ask for old output, and then it's about 12% more bytes.
So what does ie 11 change? Count the syntax:
for v in no-babel babel-ie11; do
  printf "%-15s '=>' %3s · async %2s · function %3s\n" "$v" \
    "$(grep -o '=>' out/$v/main.js | wc -l)" \
    "$(grep -o 'async' out/$v/main.js | wc -l)" \
    "$(grep -o 'function' out/$v/main.js | wc -l)"
done
no-babel        '=>'  37 · async  1 · function 119
babel-ie11      '=>'  35 · async  0 · function 148
async/await is gone, 29 more function keywords appeared — and 35 arrow functions survived. That is not what "transpiled for IE 11" is supposed to look like.
My first guess was exclude: /node_modules/: lodash-es is ESM and never went through Babel. Easy to test — drop the exclude and transpile dependencies too:
ie11-exclude-nm   26080 B · median 372 ms · '=>' 35 · await 0
ie11-include-nm   28825 B · median 507 ms · '=>' 35 · await 0
Still 35. Transpiling node_modules cost 2.7 KB and 135 ms and fixed nothing, so my guess was wrong. The arrows are in code Babel never gets to see: webpack's own runtime, generated after all loaders have run. Loaders transform modules; the bootstrap, the module map and the chunk loading code are webpack's, and they follow output.environment, which you set with target:
module.exports = {
  target: ['web', 'es5'],   // ← the runtime, not your modules
  module: { rules: [babelRuleTargetingIe11] },
};
babel-ie11 (default target)  26080 B · 680 ms · => 35 · const/let 69
babel-ie11 + target es5      26094 B · 377 ms · =>  0 · const/let  0
no babel + target es5        23270 B · 337 ms · =>  3 · const/let  4
There it is. Babel alone: 35 arrows and 69 const/let in a bundle you believed was ES5. target: ['web', 'es5'] alone: your own code is untouched. You need both, and each one silently handles only its half. If you have ever shipped a "transpiled" bundle that still threw a syntax error on an old browser, this is very likely why.
Plugins: everything loaders can't do
A loader sees one file. A plugin sees the whole compilation, through a large set of lifecycle hooks. Three you'll use immediately:
const HtmlWebpackPlugin = require('html-webpack-plugin');
const MiniCssExtractPlugin = require('mini-css-extract-plugin');
const webpack = require('webpack');

plugins: [
  new HtmlWebpackPlugin({ template: './src/app/index.html' }),
  new MiniCssExtractPlugin({ filename: '[name].[contenthash:8].css' }),
  new webpack.DefinePlugin({
    'process.env.NODE_ENV': JSON.stringify('production'),
  }),
]
HtmlWebpackPlugin exists because of hashed filenames: once your asset is main.ef0c3cbf.js, no human can maintain the <script> tag. Give it a template and it writes the tags for you:
<script defer src="main.js">
DefinePlugin is a find-and-replace at build time, and it's how the if (process.env.NODE_ENV !== 'production') blocks in React and friends disappear — the condition becomes if (false), and the minifier deletes the branch. In mode: 'production' webpack already sets that one for you; you'd use DefinePlugin for your own flags.
There's also optimization.minimizer, which people mistake for a plugin slot and half-configure. Two rules: mode: 'production' already minifies, and you only touch minimizer when you need non-default options, in which case you must re-specify the whole array.
mode is two different builds, not one build with the volume up
This is the section I'd hand to anyone debugging a "works in dev, broken in prod". Same entry, same files:
### mode: development (devtool: false)  (166 ms)
   199555 B  main.js
    29709 B  vendors-node_modules_lodash-es_groupBy_js-...js
     1446 B  src_app_chart_js.js
      435 B  main.css
  TOTAL code 231145 B · chunks 3

### mode: production  (483 ms)
    20535 B  main.js
     2439 B  81.js
      322 B  main.css
  TOTAL code 23296 B · chunks 2
231,145 → 23,296 bytes, a factor of 9.9. Worth noting how much that ratio depends on the app: for the two-file toy at the top of this guide it was 5.33 KiB → 110 bytes, a factor of 49.6. Ratios from blog posts are not portable. Measure yours.
But look again at the chunk count. Three chunks in development, two in production. The graph is the same, the imports are the same, and the output structure is different. Ask webpack why:
for (const mode of ['development', 'production']) {
  const c = webpack({ mode, entry: './src/app/main.js' });
  const s = c.options.optimization.splitChunks;
  console.log(mode, 'minSize=', s.minSize,
    'maxAsyncRequests=', s.maxAsyncRequests,
    'chunkIds=', c.options.optimization.chunkIds);
}
development  minSize= 10000  maxAsyncRequests= Infinity  chunkIds= named
production   minSize= 20000  maxAsyncRequests= 30        chunkIds= deterministic
splitChunks.minSize is 10,000 in development and 20,000 in production. The lodash-es modules behind the lazy chart weigh 14.5 KiB, so in development they clear the bar and get split into their own vendors-… chunk; in production they don't, and they ride along inside the async chunk.
The consequences are exactly the ones that make people distrust bundlers:
- The number of network requests your lazy route makes differs between dev and prod.
- Chunk filenames differ too —
chunkIds: 'named'gives yousrc_app_chart_js.js,deterministicgives you81.js. Any code that hardcodes a chunk name works in one and not the other. - A waterfall you tuned by watching the dev server is not the waterfall you shipped.
If you care about the split, pin it rather than inheriting two different defaults:
optimization: {
  splitChunks: {
    chunks: 'all',
    minSize: 20000,
  },
},
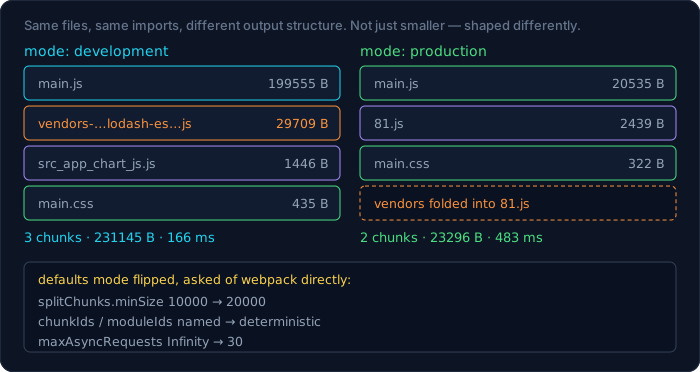
Here's the full list of what mode flipped, straight out of the resolved options:
| Option | development | production |
|---|---|---|
optimization.minimize |
false | true |
optimization.usedExports |
false | true |
optimization.sideEffects |
'flag' |
true |
optimization.concatenateModules |
false | true |
optimization.chunkIds |
named |
deterministic |
optimization.moduleIds |
named |
deterministic |
splitChunks.minSize |
10000 | 20000 |
devtool |
eval |
false |
mode: 'none' turns all of it off, which is occasionally the right answer when you're trying to see what your own code compiled to without the minifier in the way.
Code splitting: one syntax, several behaviours
The whole feature is one expression. import() returns a promise, and webpack takes it as an instruction to put everything behind it in a separate file:
document.querySelector('.card__total')
  .addEventListener('click', async () => {
    const { drawChart } = await import('./chart.js');
    drawChart(rows);
  });
Nothing else. No config. The proof is in the chunk list:
chunk {main} main.js, main.css (main) 82.5 KiB (javascript)
  321 bytes (css) 10.8 KiB (runtime) [entry] [rendered]
  > ./src/app/main.js main
chunk {src_app_chart_js} src_app_chart_js.js 578 bytes [rendered]
  > ./chart.js [./src/app/main.js] ./src/app/main.js 24:30-50
chunk {vendors-node_modules_lodash-es_groupBy_js-...} 14.5 KiB
  [rendered] split chunk (cache group: defaultVendors)
  > ./chart.js [./src/app/main.js] ./src/app/main.js 24:30-50
./src/app/main.js 24:30-50 is the exact character range of the import() that created the chunk. When you're auditing why a bundle has nineteen chunks, that column is the answer sheet.
Three things about the emitted chunk that surprise people.
The chunk name is derived from a path, and it's public. src_app_chart_js.js publishes your directory layout to anyone who opens the network tab. Use a magic comment if that bothers you:
const { drawChart } = await import(
  /* webpackChunkName: "chart" */ './chart.js'
);
The runtime knows about every chunk. That's why loading one on demand works at all — the entry bundle carries a map from chunk id to filename. Which brings us to the third thing:
optimization: { runtimeChunk: 'single' },
Without that, the map lives in your entry bundle, so changing a lazy chunk changes your entry bundle's hash. With it, the map gets its own tiny file and the entry stops churning. Here's the experiment; four builds, watching filenames:
build 1 (untouched)
  81.52b3d19d.chunk.js   main.016d3d97.css
  main.ef0c3cbf.js       runtime.8d7ed01d.js

build 2 (nothing changed)
  81.52b3d19d.chunk.js   main.016d3d97.css
  main.ef0c3cbf.js       runtime.8d7ed01d.js

build 3 (one character in chart.js — the lazy chunk)
  81.cd90ecd1.chunk.js   main.016d3d97.css
  main.ef0c3cbf.js       runtime.7af428fe.js

build 4 (one character in styles.css)
  81.cd90ecd1.chunk.js   main.763b3ac8.css
  main.ef0c3cbf.js       runtime.7af428fe.js
Build 2 is the important one: identical hashes from an identical input. If your build isn't reproducible, [contenthash] is worthless and every deploy busts every cache. Build 3 shows the lazy-chunk edit touching the chunk and the runtime, and leaving main.ef0c3cbf.js alone — that's runtimeChunk: 'single' earning its line. Build 4 touches only the CSS.
Two more knobs worth knowing before you go tuning splitChunks:
optimization: {
  splitChunks: {
    chunks: 'all',        // default is 'async' — initial chunks excluded
    minSize: 20000,
    cacheGroups: {
      vendor: {
        test: /[\\/]node_modules[\\/]/,
        name: 'vendor',
        chunks: 'all',
      },
    },
  },
},
The default is chunks: 'async', which means only lazy chunks get split. If you were expecting your node_modules to land in a vendor.js and it didn't, that default is why.
And resist the reflex to split more. Every chunk is a request, a hash to invalidate and a place for a waterfall to hide. Three or four well-chosen chunks beat twenty clever ones.
Tree shaking, measured rather than asserted
Tree shaking means dropping exports nobody imports. Two conditions: the modules have to be ESM (import/export, statically analysable), and the minifier has to be able to prove removal is safe.
format.js exports slugify, which nothing imports. Did it survive production?
grep -c "toLowerCase" dist/main.js
0
Gone. Note what I grepped for: slugify as an identifier is meaningless after mangling, so I looked for a method name inside its body instead. That distinction bit me a minute later:
grep -c "currency" dist/main.js
1
One hit — and currency is an imported and used function, so at first glance that's tree shaking working correctly. It isn't. The hit is the string currency: in the Intl.NumberFormat options object. The function itself was inlined and mangled out of existence, exactly like add at the top of this guide. Grepping a minified bundle for identifiers tells you nothing. Grep for string literals, which minifiers must preserve, and check byte sizes for everything else.
With that established, the experiment I most wanted to run. Three ways to get one lodash function, each its own production build:
// a-deep
import sumBy from 'lodash-es/sumBy.js';
// b-barrel
import { sumBy } from 'lodash-es';
// c-cjs
import { sumBy } from 'lodash';
a-deep      14133 B · webpack 379 ms
b-barrel    14133 B · webpack 273 ms
c-cjs       71321 B · webpack 670 ms
I expected the barrel import to be much worse — that's the advice everybody repeats, mine included. It isn't merely similar, it's the same file:
shasum -a 256 out/06-shake/*/bundle.js
e04c786d…6545  out/06-shake/a-deep/bundle.js
e04c786d…6545  out/06-shake/b-barrel/bundle.js
25a45c95…e85c  out/06-shake/c-cjs/bundle.js
Byte-identical. So "always deep-import lodash to help tree shaking" is obsolete advice for the ESM build. What is emphatically not obsolete is which package you install:
for (const p of ['lodash-es', 'lodash']) {
  const j = require(p + '/package.json');
  console.log(p, 'module=' + (j.module ?? '-'),
              'sideEffects=' + JSON.stringify(j.sideEffects ?? '(none)'));
}
lodash-es  module=lodash.js  sideEffects=false
lodash     module=-          sideEffects=(none)
lodash-es ships ESM and declares sideEffects: false, which is the package author telling webpack "importing a module from here has no observable effect, so feel free to drop the unused ones". lodash ships CommonJS, whose exports are computed at runtime and therefore can't be statically shaken. 14,133 bytes against 71,321 — five times the size, from one character in an import.
That flag is worth setting in your own package.json if you're publishing a library, and worth checking when a dependency bloats a bundle for no visible reason:
{
  "name": "my-lib",
  "sideEffects": false
}
If some files do have side effects — a polyfill, a CSS import, anything that runs on load — list them instead of lying:
{
  "sideEffects": ["./src/polyfills.js", "*.css"]
}
Get this wrong in the optimistic direction and tree shaking will delete code you needed, in production only, silently. It's one of the few webpack settings that can produce a bug that doesn't exist in development.
Source maps: five choices, and the price of each
devtool has more than a dozen values and the names are assembled from parts (eval, cheap, module, hidden, inline, source-map). Rather than translate the grammar, here's what the ones you'd actually pick cost, same app, same machine:
| mode | devtool | code | maps | build |
|---|---|---|---|---|
| production | false |
23,296 B | — | 446 ms |
| production | source-map |
23,396 B | 162,896 B | 364 ms |
| production | hidden-source-map |
23,296 B | 162,896 B | 343 ms |
| development | eval |
250,560 B | inline | 64 ms |
| development | eval-source-map |
472,762 B | inline | 65 ms |
| development | eval-cheap-module-source-map |
461,910 B | inline | 59 ms |
Read the map column first. 162,896 bytes of source map for 23,396 bytes of code — seven times the size of the thing it describes. That's the number that should decide whether you serve maps publicly.
The difference between the two production rows is one line at the end of the bundle:
//# sourceMappingURL=main.js.map
Exactly 100 bytes, and it's the whole distinction: source-map writes the comment so browser devtools fetch the map; hidden-source-map emits the identical map file and omits the comment, so nothing fetches it unless you hand it over deliberately. That's the setting you want with an error tracker — upload the maps at deploy time, keep readable stack traces, don't serve your source to the public. This site does exactly that, in frontend/next.config.js:
module.exports = withSentryConfig(nextConfig, {
  hideSourceMaps: true,
  widenClientFileUpload: true,
});
The development rows carry a warning about my own measurement. The three build times — 64, 65, 59 ms — say source maps are free, and for a four-file app they are. That number will not survive a real codebase; the cheap and module parts of those names exist precisely because on large projects the difference is seconds per rebuild. I measured a small app honestly and I'm not going to pretend it generalises.
One structural detail: the eval-* variants produce no .map files at all. The maps are base64 blobs inside the eval() strings, which is why the bundle nearly doubles (250,560 → 472,762 B) and why rebuilds stay fast — nothing has to be written to disk.
Practical defaults: eval-cheap-module-source-map in development, hidden-source-map in production if you run an error tracker, false if you don't.
The dev server, and what HMR actually sends
npm i -D webpack-dev-server
devServer: {
  port: 4321,
  hot: true,
  host: '127.0.0.1',
},
npx webpack serve
<i> [webpack-dev-server] Project is running at:
<i> [webpack-dev-server] Loopback: http://127.0.0.1:4321/
asset main.js 385 KiB [emitted] (name: main)
runtime modules 37.7 KiB 16 modules
Two numbers to notice. main.js is now 394,643 bytes — up from 250,560 for the same code without the dev server — and the runtime went from 11 modules / 10.8 KiB to 16 modules / 37.7 KiB. The HMR client is compiled into your bundle, not added as a script tag. You can verify that from the served HTML:
curl -s http://127.0.0.1:4321/ | grep -oE '<script[^>]*>'
<script defer src="main.js">
One tag, no injected client, no second connection to configure. Now the interesting part. With the server running, I changed one string in format.js — 'vi-VN' to 'en-US' — and watched the output directory:
before                              after
  index.html                          index.html
  main.css                            main.0e2a…hot-update.js    ← new
  main.js                             main.0e2a…hot-update.json  ← new
  src_app_chart_js.js                 main.css
  vendors-…groupBy…orderBy….js        main.js
cat dist/main.0e2a3a4ceff3fab38f80.hot-update.json
{"c":["main"],"r":[],"m":[]}
Twenty-eight bytes: c is the chunks that changed, r removed chunks, m removed modules. The patch beside it:
ls -l dist/*.hot-update.js
grep -oE '"\./src/app/[a-z]+\.js"' dist/*.hot-update.js | sort -u
1792 B  main.0e2a3a4ceff3fab38f80.hot-update.js
  "./src/app/format.js"
1,792 bytes containing exactly the one module I edited. And the rebuild:
cached modules 213 KiB (javascript) 321 bytes (css) [cached] 150 modules
./src/app/format.js 347 bytes [built] [code generated]
webpack 5.109.2 compiled successfully in 29 ms
150 modules served from cache, one rebuilt, 29 ms. The browser receives a 1.79 KB patch instead of reloading 394 KB — a 220× difference in bytes moved, which is the entire reason HMR feels different from a page refresh.
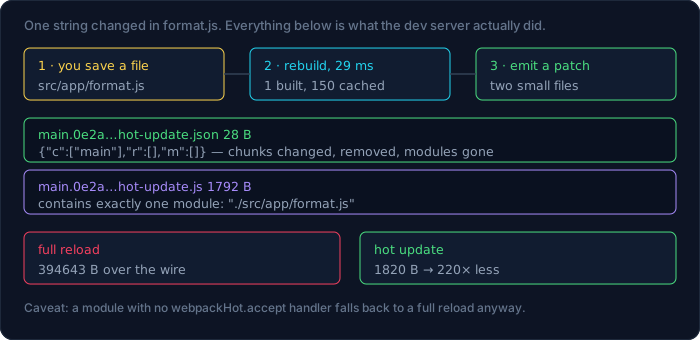
The catch nobody mentions until it bites: HMR needs someone to accept the update. Frameworks install that handler for you (React Fast Refresh, Vue's SFC runtime). In plain JavaScript, a module with no handler causes the dev server to fall back to a full reload, and you'll swear HMR is broken when it's doing precisely what you told it. The manual version:
if (import.meta.webpackHot) {
  import.meta.webpackHot.accept('./format.js', () => {
    render();   // your code re-runs with the new module
  });
}
Two dev-server settings worth knowing on day one:
devServer: {
  historyApiFallback: true,   // SPA routes: /users/3 serves index.html
  proxy: [{ context: ['/api'], target: 'http://localhost:4000' }],
},
historyApiFallback is the fix for "my app works at / and 404s at /users/3". proxy is how you avoid CORS in development without weakening anything in production.
Reading a build you didn't write
Sooner or later you inherit a config and a bundle that's too big. The tool for that is --json, and the first thing to know is its cost:
npx webpack --json > stats.json
stats.json = 2131 KB for a 4-file app
Two megabytes of JSON for four source files, so don't open it in an editor. Query it:
const s = require('./stats.json');
const flat = [];
const walk = (ms) => ms.forEach((m) =>
  m.modules?.length ? walk(m.modules) : flat.push(m));
walk(s.modules);

const by = {};
flat.forEach((m) => {
  const pkg = (m.name.match(/node_modules\/([^/]+)/) ?? [, 'src/'])[1];
  by[pkg] = (by[pkg] ?? 0) + (m.size ?? 0);
});
console.log(Object.entries(by).sort((a, b) => b[1] - a[1]));
   176719 B  lodash-es
    12914 B  src/ (includes webpack's own runtime modules)

5 largest source modules:
    3744 B  ./node_modules/lodash-es/_equalByTag.js
    3488 B  webpack/runtime/css loading
    3097 B  webpack/runtime/jsonp chunk loading
    3008 B  ./node_modules/lodash-es/_baseIsEqualDeep.js
Useful immediately: 176 KB of lodash-es source for three functions, and webpack/runtime/css loading plus webpack/runtime/jsonp chunk loading together are 6.6 KB of source in an app with four files of my own. That runtime is the price of code splitting and native CSS, and it's a fixed cost you should know about before you split a small app into six chunks.
For a picture instead of a table:
npm i -D webpack-bundle-analyzer
npx webpack --profile --json > stats.json
npx webpack-bundle-analyzer stats.json
Now, a confession, because it's the most useful thing in this section.
My first version of that query reported 152 modules in production against 138 in development, and 168,579 bytes of lodash in production against 98,087 in development. Production had somehow grown. A later script reported 105 modules duplicated across chunks. Both were false, and both were my own bug: under module concatenation, stats.modules lists the concatenated parent and its children, so a naive walk counts everything twice. The "duplicates" had empty chunks arrays, which was the tell I initially skipped past.
The check that actually settled it looks for string literals — the thing a minifier cannot rename — in each emitted file:
for s in '\[object Date\]' 'Expected a function' '__lodash'; do
  printf "  %-22s main.js:%s  81.js:%s\n" "$s" \
    "$(grep -c "$s" dist/main.js)" "$(grep -c "$s" dist/81.js)"
done
  \[object Date\]        main.js:1  81.js:0
  Expected a function    main.js:1  81.js:0
  __lodash               main.js:1  81.js:0
Zero duplication: the shared lodash internals live in the initial chunk only. Three separate times in one afternoon, my measuring script was wrong in a way that produced a confident, plausible, publishable number. Verify the instrument before you trust the reading — feed it a case whose answer you already know, and prefer signals the build can't rewrite (bytes on disk, string literals, file hashes) over signals it can (identifiers, module counts).
Build speed: the cache, and the exit
Before reaching for a different bundler, turn on the persistent cache. One option:
cache: {
  type: 'filesystem',
  cacheDirectory: path.resolve(__dirname, '.wpcache'),
},
build 1: 448 ms      (cold)
build 2:  97 ms
build 3:  98 ms
cache on disk: 2.3M
4.6× faster after the first build, for 2.3 MB of disk. It survives process restarts, which is the point — this is the difference between a CI build and a local rebuild, and between a fast webpack --watch and a slow one. Add .wpcache to .gitignore and move on.
Now the honest comparison. Same entry, same bundling, same minification, both timed wall-clock over three runs:
npx esbuild src/app/main.js --bundle --minify --splitting \
  --format=esm --outdir=dist-esbuild
esbuild:  real 0.33   real 0.32   real 0.33   → 19,336 B in 4 files
webpack:  real 1.06   real 1.04   real 1.04   → 23,296 B in 3 files
esbuild is 3.2× faster wall-clock and produces 17% fewer bytes here. Some of that size difference is structural rather than clever: esbuild's ESM output uses the browser's own module loader, so it doesn't ship a __webpack_require__ runtime at all — its entry file is 892 bytes against webpack's 20,535.
That result is not a scandal, and it doesn't make the last eight sections useless. It sets the terms for the final question.
When not to use webpack
Three cases, and I'd guess most readers are in one of them.
You're using a framework that already owns the bundler. Next.js, Nuxt, SvelteKit, Angular, Remix — the build is theirs. This site runs Next 14.2.15, which bundles its own copy:
const w = require('next/dist/compiled/webpack/webpack.js');
w.init();
console.log('webpack in Next 14.2.15 =', w.webpack.version);
webpack in Next 14.2.15 = 5.90.0
There is no webpack.config.js in this repo and there shouldn't be. What that version does determine is which advice applies: 5.90 is on the old side of the CSS line above, so inside a Next 14 build css-loader is still doing the work. The reason to understand webpack here isn't to configure it, it's to read next build output, know what a chunk is when the analyser shows you one, and understand what hideSourceMaps: true actually changes.
You're starting a new app with no unusual requirements. Use Vite. Its dev server doesn't bundle at all during development, its production build is Rollup, and you will write roughly six lines of config for the lifetime of the project.
You're building a library. Rollup or tsup, not webpack. Libraries want clean ESM and CJS outputs with externals preserved; webpack's runtime is designed for shipping applications to browsers.
Where webpack still wins, and this is genuine: the plugin and loader ecosystem is unmatched, so if your build needs something odd — a custom asset pipeline, Module Federation across separately deployed apps, an obscure legacy target, a loader that only exists for webpack — it's the mature choice. And it's what many frameworks quietly run underneath, which makes learning it a way of understanding builds you don't control.
That's roughly the same conclusion this site reached about GraphQL: the technology is good, and the right answer for us was still the boring one, chosen deliberately.
A config worth keeping
Everything above, in one file, with the reasons attached:
const path = require('node:path');
const HtmlWebpackPlugin = require('html-webpack-plugin');

const isProd = process.env.NODE_ENV === 'production';

module.exports = {
  mode: isProd ? 'production' : 'development',
  entry: './src/main.js',

  output: {
    path: path.resolve(__dirname, 'dist'),
    // hash in prod so assets cache forever; plain names in dev
    filename: isProd ? '[name].[contenthash:8].js' : '[name].js',
    chunkFilename: isProd
      ? '[name].[contenthash:8].chunk.js'
      : '[name].chunk.js',
    clean: true,
    publicPath: '/',
  },

  // maps: cheap in dev, hidden in prod (upload, don't serve)
  devtool: isProd ? 'hidden-source-map' : 'eval-cheap-module-source-map',

  module: {
    rules: [
      {
        test: /\.jsx?$/,
        exclude: /node_modules/,
        use: 'babel-loader',
      },
      // assets: inline below 8 KB, emit a file above it
      {
        test: /\.(png|jpe?g|gif|svg|woff2?)$/,
        type: 'asset',
        parser: { dataUrlCondition: { maxSize: 8 * 1024 } },
      },
    ],
  },

  plugins: [new HtmlWebpackPlugin({ template: './src/index.html' })],

  optimization: {
    // pin it: the default differs between dev and prod
    splitChunks: { chunks: 'all', minSize: 20000 },
    // keep the chunk map out of the entry bundle
    runtimeChunk: 'single',
  },

  resolve: {
    extensions: ['.js', '.jsx'],
    alias: { '@': path.resolve(__dirname, 'src') },
  },

  cache: { type: 'filesystem' },

  devServer: {
    port: 3000,
    hot: true,
    historyApiFallback: true,
    proxy: [{ context: ['/api'], target: 'http://localhost:4000' }],
  },

  // budgets: fail loudly instead of drifting
  performance: {
    maxEntrypointSize: 250000,
    maxAssetSize: 250000,
    hints: isProd ? 'warning' : false,
  },
};
Two entries in there I haven't shown running. type: 'asset' is webpack 5's replacement for file-loader and url-loader, which you should delete if you still have them. performance turns silent bundle growth into a warning — the same instinct as the smoke test in this repo's deploy.sh, which fails the deploy when a core route returns 404 rather than letting a stale build sit in production looking fine.
Cheat sheet
npx webpack                      # build with webpack.config.js
npx webpack --mode development   # override mode
npx webpack --watch              # rebuild on change
npx webpack serve                # dev server + HMR
npx webpack --json > stats.json  # machine-readable build report
npx webpack --version            # decides which advice applies to you
| Symptom | Cause |
|---|---|
Module parse failed … appropriate loader |
no loader for that type; read the @ … line for the importer |
output.path … is not an absolute path |
use path.resolve(__dirname, 'dist') |
| bundle is minified when you didn't ask | mode unset → defaults to production |
| chunk count differs dev vs prod | splitChunks.minSize 10000 vs 20000 |
| "transpiled" bundle still has arrows | Babel doesn't touch the runtime; set target: ['web','es5'] |
| CSS edit busts the JS cache | style-loader puts CSS inside the JS |
| entry hash changes on every lazy-chunk edit | missing optimization.runtimeChunk: 'single' |
| dependency is 5× bigger than expected | it's CommonJS, or has no sideEffects: false |
| HMR always full-reloads | nothing called webpackHot.accept |
| rebuilds slow after restart | no cache: { type: 'filesystem' } |
What I got wrong writing this
Six things, and they're the reason this guide exists in a world that already has a webpack documentation site.
- "You need css-loader for CSS." True on webpack 5.90, false on 5.109, where
experiments.cssdefaults to'auto'. I nearly published the version that was wrong for current webpack and right for the version this site runs. - "Dev and prod build the same graph." They don't:
splitChunks.minSizeis 10,000 versus 20,000, so this app has three chunks in development and two in production. - "Deep-import lodash to help tree shaking." The barrel import produced a byte-identical bundle, same SHA-256. The 5× difference is
lodashversuslodash-es, not the import style. - "babel-loader gives you an ES5 bundle." It left 35 arrow functions and 69
const/letin webpack's own runtime.target: ['web','es5']is the other half. - "Babel is a significant build cost." With
targets: 'defaults', four bytes and a time difference smaller than the noise between runs of the same build. - My own measuring scripts lied three times — inflated module counts, 105 phantom duplicate modules, and a
grephit on a mangled identifier that was really an object key. Every one produced a number confident enough to publish.
The last one is the transferable lesson. A build tool's job is to rewrite your code, so the artefacts it produces are a poor place to look for the names you wrote. Measure bytes, hashes and string literals; treat identifiers and module counts as hearsay; and give your instrument a case with a known answer before you believe the case that doesn't.
Where to go next
- How to Use the Command Line in Linux and macOS — the tools every measurement above depends on:
grepon emitted files,statfor byte counts, killing a dev server by port instead of by name. - The Event Loop, Callbacks, Promises and Async/Await — what
await import('./chart.js')does at runtime, once the bundler has finished deciding which file that lives in. - Code Lab — graded JavaScript, TypeScript and React exercises. Build output is easier to reason about when the modules going in are ones you wrote and tested.
Bài liên quan

Chuyên sâu
Mã hoá cho lập trình viên: AES, RSA, chữ ký số — và vì sao đừng bao giờ tự viết thuật toán
Bắt đầu từ một file bài thi .dat mở ra không được: entropy 7,99 nói lên điều gì, vì sao dò khoá AES là bất khả thi về mặt VẬT LÝ chứ không phải "rất khó", AES khác RSA ra sao (đo thật: chênh ~1.520 lần). Kèm thí nghiệm ECB làm lộ nguyên hình ổ khoá và sáu vụ sập kinh điển.

Chuyên sâu
Có bao nhiêu loại cơ sở dữ liệu — và chọn cái nào cho việc gì
"SQL hay NoSQL" là phép chia sai: một vế là ngôn ngữ, vế kia nghĩa đen là "không phải cái kia". Bài này chia lại theo mô hình dữ liệu (11 loại), theo tải công việc và theo cách triển khai; giải thích ACID, mức cô lập, write skew, CAP bị hiểu sai ở đâu, B-tree so với LSM-tree; kèm cây quyết định, mười sai lầm hay gặp, và hồ sơ thật của chính trang này — 248 bảng trên một Postgres, một VPS 6GB.
Chuyên sâu
How to Use the Command Line in Linux and macOS
A complete beginner-to-competent guide to the shell: paths, permissions, pipes, processes, your shell config, and a backup script with the four lines of ceremony that separate a script that fails loudly from one that fails silently. Every command verified on both macOS (BSD) and Linux (GNU).
Chuyên sâu
Reading Production: Logs, Metrics and a Calm Head
The first ten minutes of an incident, as commands rather than philosophy. Exit 137 does not mean OOM, three of four containers ignore SIGTERM entirely, both of my "healthy" containers were healthy and one was broken — and the one curl that tells you a deploy shipped a stale image before any user does.
Bình luận